
Families are struggling to get ahead as living expenses and commercial childcare costs soar
– Almost 40 percent of upper-middle-class parents surveyed said they rely on extended family for childcare, compared to 29 percent of low-income parents.
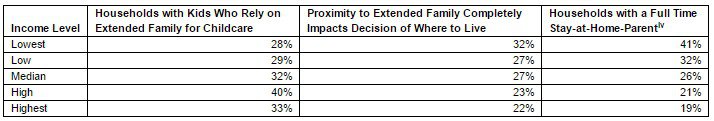
– About 26 percent of respondents said proximity to family drives their decision about where to live, with the trend more pronounced among low-income households in expensive markets.
– Across all income brackets, 33 percent of households with children rely on extended family for childcare and 17 percent get help covering living expenses.
– Housing and childcare expenses cost about $43,652 a year in urban areas and about $34,579 a year in the suburbs.
Upper-middle-class families are more likely than low or upper-class families to rely on their extended family for childcare, according to the Zillow® Housing Aspirations Report™ (ZHAR)ii.
Almost 40 percent of upper-middle-class parents surveyed said they rely on extended family for childcare, compared 29 percent of low-income parents and 33 percent of high-income parents.
Zillow’s finding highlights another way middle-class families are struggling to get ahead as living expenses and commercial childcare costs soar and incomes remain flat.
Incomes are up 2.6 percent over the past year, while home values are up over 7 percent. Housing affordability is a growing concern across the country, and in some of the most expensive housing markets, a typical mortgage payment requires 40 percent or more of the area’s median monthly income.
Commercial childcare can cost up to $21,000 a year, which only the most affluent households can afford. Some parents in families making the least may not earn enough at a full or part-time job to cover the cost of childcare, so having a stay-at-home parent often makes financial sense.
But the families in the middle, often with two working parents making moderate incomes, can’t afford to send their kids to childcare and also can’t afford for one parent to stay home.
“Housing costs and child care are among the two largest budget items for working families, costing as much $43,000 a year in urban areas and over $34,000 a year in the suburbs,” said Zillow Chief Economist Dr. Svenja Gudell. “While many Americans are tied to the places they live for a variety of personal and financial reasons, it’s necessary for some households to live near family in order to make ends meet. Sometimes an extended family might move together to provide childcare, or grandparents might even follow their children when they move to a new city to help care for their grandkids.”
About 26 percent of respondents said proximity to family drives their decision about where to live. This trend is more pronounced among low-income households in the nation’s most expensive housing markets. In San Francisco, for example, almost half of all low-income respondents said family completely impacts their decision on where to live.
Across all income brackets, 33 percent of American households with children rely on extended family for childcare assistance. Almost one-in-five households said they get help from family to cover living expenses, and 11 percent turn to extended family for help with eldercare.
|
Metro |
Classification |
Property Taxes and Mortgage Payment (Annual) |
Annual Child Care Costs (Child Care Center for 2 Kids) |
Total Annual Housing and Child Care Expenses |
|
United States |
Suburban |
$ 15,006 |
$ 19,573 |
$ 34,579 |
|
United States |
Urban |
$ 22,271 |
$ 21,381 |
$ 43,652 |
|
Atlanta, GA |
Suburban |
$ 13,569 |
$ 17,236 |
$ 30,805 |
|
Atlanta, GA |
Urban |
$ 22,435 |
$ 20,927 |
$ 43,362 |
|
Austin, TX |
Suburban |
$ 17,279 |
$ 18,989 |
$ 36,268 |
|
Austin, TX |
Urban |
$ 25,661 |
$ 22,129 |
$ 47,790 |
|
Baltimore, MD |
Suburban |
$ 15,568 |
$ 19,493 |
$ 35,061 |
|
Baltimore, MD |
Urban |
$ 5,904 |
$ 18,367 |
$ 24,271 |
|
Birmingham, AL |
Suburban |
$ 13,338 |
$ 20,820 |
$ 34,158 |
|
Birmingham, AL |
Urban |
$ 16,498 |
$ 18,356 |
$ 34,854 |
|
Boston, MA |
Suburban |
$ 24,483 |
$ 27,078 |
$ 51,561 |
|
Boston, MA |
Urban |
$ 32,130 |
$ 27,507 |
$ 59,637 |
|
Chicago, IL |
Suburban |
$ 28,408 |
$ 20,386 |
$ 48,794 |
|
Chicago, IL |
Urban |
$ 45,335 |
$ 21,931 |
$ 67,266 |
|
Cincinnati, OH |
Suburban |
$ 15,267 |
$ 16,613 |
$ 31,880 |
|
Cincinnati, OH |
Urban |
$ 12,607 |
$ 13,759 |
$ 26,366 |
|
Cleveland, OH |
Suburban |
$ 15,134 |
$ 17,513 |
$ 32,647 |
|
Cleveland, OH |
Urban |
$ 7,625 |
$ 15,988 |
$ 23,613 |
|
Dallas-Fort Worth, TX |
Suburban |
$ 14,342 |
$ 16,373 |
$ 30,715 |
|
Dallas-Fort Worth, TX |
Urban |
$ 24,417 |
$ 20,426 |
$ 44,843 |
|
Denver, CO |
Suburban |
$ 44,875 |
$ 21,184 |
$ 66,059 |
|
Denver, CO |
Urban |
$ 40,564 |
$ 21,860 |
$ 62,424 |
|
Houston, TX |
Suburban |
$ 12,584 |
$ 15,268 |
$ 27,852 |
|
Houston, TX |
Urban |
$ 16,538 |
$ 16,682 |
$ 33,220 |
|
Las Vegas, NV |
Suburban |
$ 15,934 |
$ 17,711 |
$ 33,645 |
|
Las Vegas, NV |
Urban |
$ 10,481 |
$ 15,846 |
$ 26,327 |
|
Los Angeles-Long Beach-Anaheim, CA |
Suburban |
$ 34,943 |
$ 21,280 |
$ 56,223 |
|
Los Angeles-Long Beach-Anaheim, CA |
Urban |
$ 34,042 |
$ 21,774 |
$ 55,816 |
|
Miami-Fort Lauderdale, FL |
Suburban |
$ 16,298 |
$ 16,860 |
$ 33,158 |
|
Miami-Fort Lauderdale, FL |
Urban |
$ 16,437 |
$ 18,664 |
$ 35,101 |
|
Milwaukee, WI |
Suburban |
$ 14,100 |
$ 21,246 |
$ 35,346 |
|
Milwaukee, WI |
Urban |
$ 7,431 |
$ 19,688 |
$ 27,119 |
|
Minneapolis-St Paul, MN |
Suburban |
$ 14,899 |
$ 19,970 |
$ 34,869 |
|
Minneapolis-St Paul, MN |
Urban |
$ 14,710 |
$ 24,089 |
$ 38,799 |
|
New Orleans, LA |
Suburban |
$ 25,180 |
$ 14,165 |
$ 39,345 |
|
New Orleans, LA |
Urban |
$ 23,675 |
$ 14,834 |
$ 38,509 |
|
New York, NY |
Suburban |
$ 28,668 |
$ 23,253 |
$ 51,921 |
|
New York, NY |
Urban |
$ 101,590 |
$ 21,568 |
$ 123,158 |
|
Philadelphia, PA |
Suburban |
$ 19,439 |
$ 19,575 |
$ 39,014 |
|
Philadelphia, PA |
Urban |
$ 7,402 |
$ 17,753 |
$ 25,155 |
|
Phoenix, AZ |
Suburban |
$ 32,097 |
$ 17,110 |
$ 49,207 |
|
Phoenix, AZ |
Urban |
$ 26,893 |
$ 15,747 |
$ 42,640 |
|
Pittsburgh, PA |
Suburban |
$ 10,988 |
$ 17,185 |
$ 28,173 |
|
Pittsburgh, PA |
Urban |
$ 6,916 |
$ 16,999 |
$ 23,915 |
|
Portland, OR |
Suburban |
$ 21,909 |
$ 19,938 |
$ 41,847 |
|
Portland, OR |
Urban |
$ 26,575 |
$ 23,270 |
$ 49,845 |
|
Providence, RI |
Suburban |
$ 16,394 |
$ 20,473 |
$ 36,867 |
|
Providence, RI |
Urban |
$ 12,389 |
$ 17,504 |
$ 29,893 |
|
Sacramento, CA |
Suburban |
$ 19,555 |
$ 18,873 |
$ 38,428 |
|
Sacramento, CA |
Urban |
$ 25,847 |
$ 23,403 |
$ 49,250 |
|
San Antonio, TX |
Suburban |
$ 11,378 |
$ 16,135 |
$ 27,513 |
|
San Antonio, TX |
Urban |
$ 8,126 |
$ 16,913 |
$ 25,039 |
|
San Diego, CA |
Suburban |
$ 30,996 |
$ 21,398 |
$ 52,394 |
|
San Diego, CA |
Urban |
$ 27,803 |
$ 20,036 |
$ 47,839 |
|
San Francisco, CA |
Suburban |
$ 46,087 |
$ 26,177 |
$ 72,264 |
|
San Francisco, CA |
Urban |
$ 52,730 |
$ 32,094 |
$ 84,824 |
|
San Jose, CA |
Suburban |
$ 59,539 |
$ 27,991 |
$ 87,530 |
|
San Jose, CA |
Urban |
$ 55,388 |
$ 30,514 |
$ 85,902 |
|
Seattle, WA |
Suburban |
$ 21,289 |
$ 22,003 |
$ 43,292 |
|
Seattle, WA |
Urban |
$ 28,349 |
$ 26,319 |
$ 54,668 |
|
Washington, DC |
Suburban |
$ 21,425 |
$ 21,660 |
$ 43,085 |
|
Washington, DC |
Urban |
$ 28,134 |
$ 27,783 |
$ 55,917 |